An interactive atlas · 2000–2025 · DSC 106

The World Is Getting Greener — But Momentum Is Uneven.

Satellite data spanning 25 years shows a broad greening signal across the Americas. But the trend is not equally strong everywhere. The Amazon remains one of the greenest places on Earth — yet compared with faster-greening regions, its long-term momentum is weak.

Shaun Israni Hoang Pham Jared Wang
MODIS NDVI · Americas · Jul 2024 · NASA GIBS
MODIS NDVI heatmap of the Americas, July 2024
Chapter 01 · Step 1

Satellites have been watching the planet breathe since 2000.

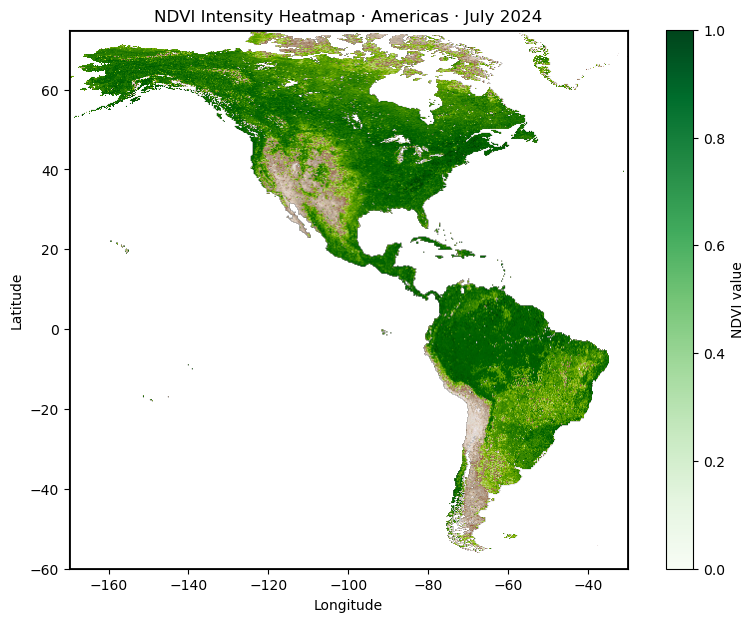
NASA's MODIS instrument has been measuring the Normalized Difference Vegetation Index (NDVI) every month since March 2000, producing a continuous record of plant life across the entire planet — forests, grasslands, and croplands alike.

Chapter 01 · Step 2

NDVI is a ratio, not a photo.

NDVI measures the ratio of reflected near-infrared to red light. Healthy, dense vegetation absorbs red and reflects infrared — yielding values near 1. Bare soil and water hover near 0. The color scale below maps yellow-greens to sparse cover, deep greens to dense canopy.

This July 2024 snapshot shows the Americas at peak Northern Hemisphere summer — the Midwest and Canada flush with growth, the Amazon a deep perennial green year-round.
Chapter 01 · Step 3

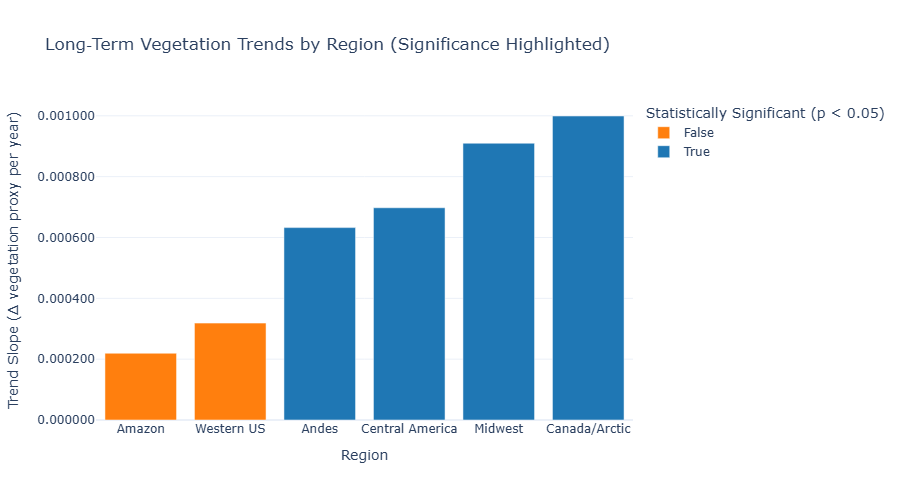
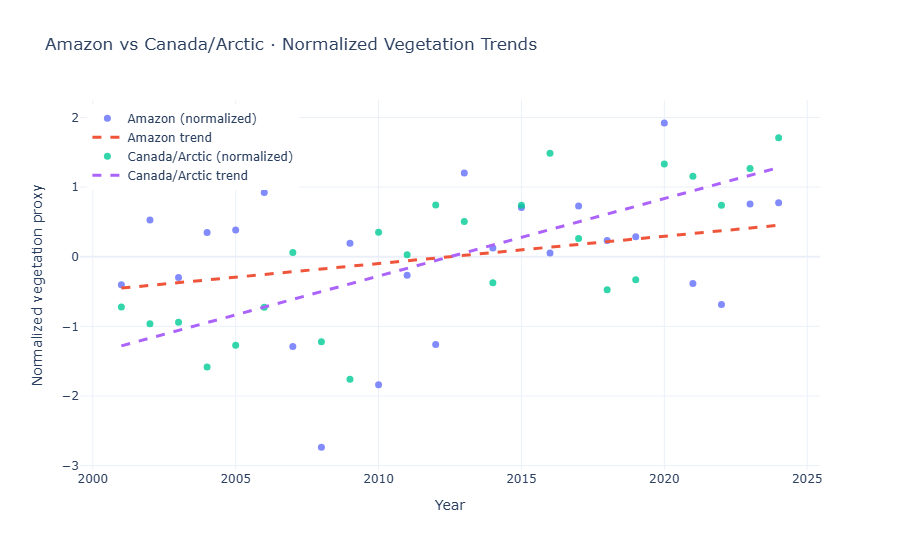
A snapshot shows density. The trend shows momentum.

High NDVI in a single month tells us vegetation is dense right now. It says nothing about whether that density is growing, stalling, or eroding over years. To understand trajectory, we need to look at the slope of the entire 25-year record.

Regional NDVI trend slope · 2000–2025
NDVI trend comparison: Amazon vs Canada/Arctic
Chapter 02 · Step 1

Every region is getting greener.

When we fit a linear trend across the full monthly NDVI record for each region, every region shows a positive slope. At the broadest level, the story is greening: vegetation is increasing, growing seasons are lengthening, and plant cover is gaining ground.

All slopes positive
Chapter 02 · Step 2

But positive does not always mean convincing.

Statistical significance (p < 0.05) separates strong trends from patterns that may still be noise. Canada/Arctic, the Andes, Central America, and the Midwest clear this threshold. The Western US and the Amazon also slope upward, but their increases are not strong enough to be statistically confirmed.

4 significant 2 uncertain
Chapter 02 · Step 3

The same direction can hide very different speeds.

Some regions are greening quickly, helped by longer growing seasons, agricultural intensification, or vegetation expanding into previously colder landscapes. Others move only slightly upward. That means the important question is no longer just whether NDVI is increasing — it is how strongly, and with how much confidence.

The story shifts from simple greening to uneven momentum: some regions are gaining vegetation rapidly, while others are barely moving.
Chapter 02 · Step 4

Canada's slope is 4.6× steeper than the Amazon's.

Indexed to 2000, Canada/Arctic's NDVI climbs clearly over the record. The Amazon's line, by comparison, is nearly flat. Both regions may be green, but their momentum is not the same.

The Amazon is not visibly barren. It is still deeply green. The concern is subtler: its increase is so weak that it fails to reach statistical significance.

Every region is getting greener.
But the Amazon, one of the greenest places on Earth, is barely gaining ground.
The story is not vegetation loss. It is stalled momentum.

Amazon basin · vegetation trend
Amazon rainforest canopy
Chapter 03 · Step 1

A dense forest can still have a weak trend.

NDVI snapshots show the Amazon as one of the greenest places on Earth: dense, dark, and green year-round. But high baseline vegetation can hide whether the forest is actually gaining strength over time.

Amazon basin · weak momentum
Chapter 03 · Step 2

High NDVI is not the same as resilience.

The Amazon's greenness is partly a baseline: it begins the record as a dense tropical forest. The slope asks a different question — not how green it is today, but whether it is becoming greener, holding steady, or falling behind the pace of change elsewhere.

The snapshot shows density. The slope reveals momentum. In the Amazon, that momentum is weak.
Chapter 04

Explore the momentum — interactively.

Scrub through the 25-year NDVI record, zoom into any region, and compare two months side by side. Hover any pixel to reveal its local vegetation proxy, or highlight a custom region to view its trend, slope, and statistical significance. The Amazon's stalled momentum becomes clearer when you compare it directly against faster-greening regions.

Interactive · NDVI explorer

NDVI Heatmap Viewer

2000 2025
Hover vegetation proxy: —
Comparing Left map follows the slider.

Slider time

Hover vegetation proxy: —

Later time

Hover vegetation proxy: —
2000 2025